PyTorch vs. JAX vs. TensorFlow: A Roofline Benchmark Across 5 Architectures
An empirical investigation comparing PyTorch 2.14, JAX 0.11, and TensorFlow across five model architectures and four batch sizes, measuring compiler speedups, kernel overheads, and hardware limits on Apple Silicon.
- Published
- updated
- Read
- 13 min
On this page
- The Experimental Setup
- Architectures under test
- Framework variants & measurement protocol
- 1. Where Models Land on the Roofline Frontier
- 2. Latency Breakdown by Architecture
- 3. The Compilation Showdown
- tf.function is transformative (10× to 17× speedup)
- jax.jit provides surgical fusion and near-roofline efficiency
- torch.compile() on CPU: Diminishing returns & regressions
- 4. Roofline Efficiency Heatmap
- What is eating the headroom?
- 5. Scaling with Batch Size
- 6. Measurement Stability & Noise
- Architecture-by-Architecture Winners
- Practical Takeaways for ML Engineers
- Code and Reproducibility
When evaluating machine learning frameworks, standard benchmarks often reduce the comparison to a single toy workload—a giant matrix multiplication or a standard ResNet-50 training pass—and declare a universal winner. But runtime performance is rarely that simple. A framework’s actual execution speed depends on its memory allocator, how its compiler handles kernel fusion, whether it can eliminate Python dispatch overhead, and the arithmetic intensity of the model architecture itself.
Following the release of neural-cost (and our introductory overview of roofline modeling), we conducted an extensive cross-framework scientific benchmark—documented in full in the GitHub Benchmark Report—to test how modern ML runtimes perform across diverse network topologies. Rather than merely recording wall-clock time, we analyzed each workload through the lens of a Roofline model to determine how close to the hardware’s theoretical limits each runtime gets.
We evaluated five distinct model topologies across PyTorch 2.14, JAX 0.11, and TensorFlow, comparing eager execution against compiled graph modes (torch.compile, jax.jit, and tf.function) across batch sizes from 1 to 128.
Here is what the empirical data revealed.
The Experimental Setup
All benchmarks were executed on an Apple M3 processor with unified memory architecture. Before running any model evaluations, we characterized the system’s empirical limits using neural-cost’s built-in hardware detection and STREAM triad benchmark:
- Target Device: Apple M3 (8-core CPU)
- Peak FP32 Compute: 3.60 TFLOP/s
- Theoretical Peak Bandwidth: 100 GB/s
- Empirical Bandwidth (STREAM triad): 41.8 GB/s
- Hardware Ridge Point: 36.0 FLOP/byte
The ridge point (36.0 FLOP/byte) is the critical threshold of the roofline model: workloads with an arithmetic intensity below 36 FLOPs per byte of memory traffic are fundamentally memory-bandwidth bound, while workloads above 36 FLOP/byte are theoretically compute bound.
Architectures under test
We implemented five representative model architectures with equivalent layer dimensions and weight counts across all three frameworks:
| Architecture | Topology & Parameters | Computational Profile |
|---|---|---|
| Feedforward DNN | 784 → 128 → 128 → 10, ReLU + LayerNorm (~475k params) | Memory-bound dense projections |
| CNN | Conv64 (3×3) → BN → MaxPool → Conv128 (3×3) → BN → GAP → Dense10 | Spatial convolutions & pooling |
| Vanilla RNN | 2-layer RNN, hidden=128, seq=32 (~267k params) | Sequential recurrence & loop overhead |
| LSTM | 2-layer LSTM (4-gate cell), hidden=128, seq=32 (~1.1M params) | Recurrent gating & elementwise ops |
| Transformer | 2-layer Encoder (MHA h=4, , FFN×4, seq=32) (~1.5M params) | Multi-head self-attention & layer norms |
Framework variants & measurement protocol
Each framework was tested in two modes:
- PyTorch 2.14: Eager baseline vs.
torch.compile()using the Inductor CPU backend. - JAX 0.11: Eager XLA baseline vs.
jax.jit()with full ahead-of-time graph compilation. - TensorFlow: Eager baseline vs.
tf.function()graph mode.
To ensure statistical rigor, we executed the automated benchmark runner benchmarks/collect_data.py:
- Warmup: 15 full iterations per configuration to allow all JITs, static compilation graphs, and memory allocators to stabilize completely.
- Timed repeats: 40 timed iterations per configuration.
- Metrics recorded: Median latency, standard deviation (), coefficient of variation (CV%), roofline efficiency (
lower_bound / observed), and achieved GFLOP/s. - Batch sweep: batch sizes of 1, 8, 32 and 128.
1. Where Models Land on the Roofline Frontier
The roofline model plots operational intensity (FLOPs per byte of memory traffic) on the x-axis against computational throughput (GFLOP/s) on the y-axis. The ceiling represents the hardware’s ultimate capabilities: an inclined slope limited by memory bandwidth, followed by a flat plateau capped by peak compute.
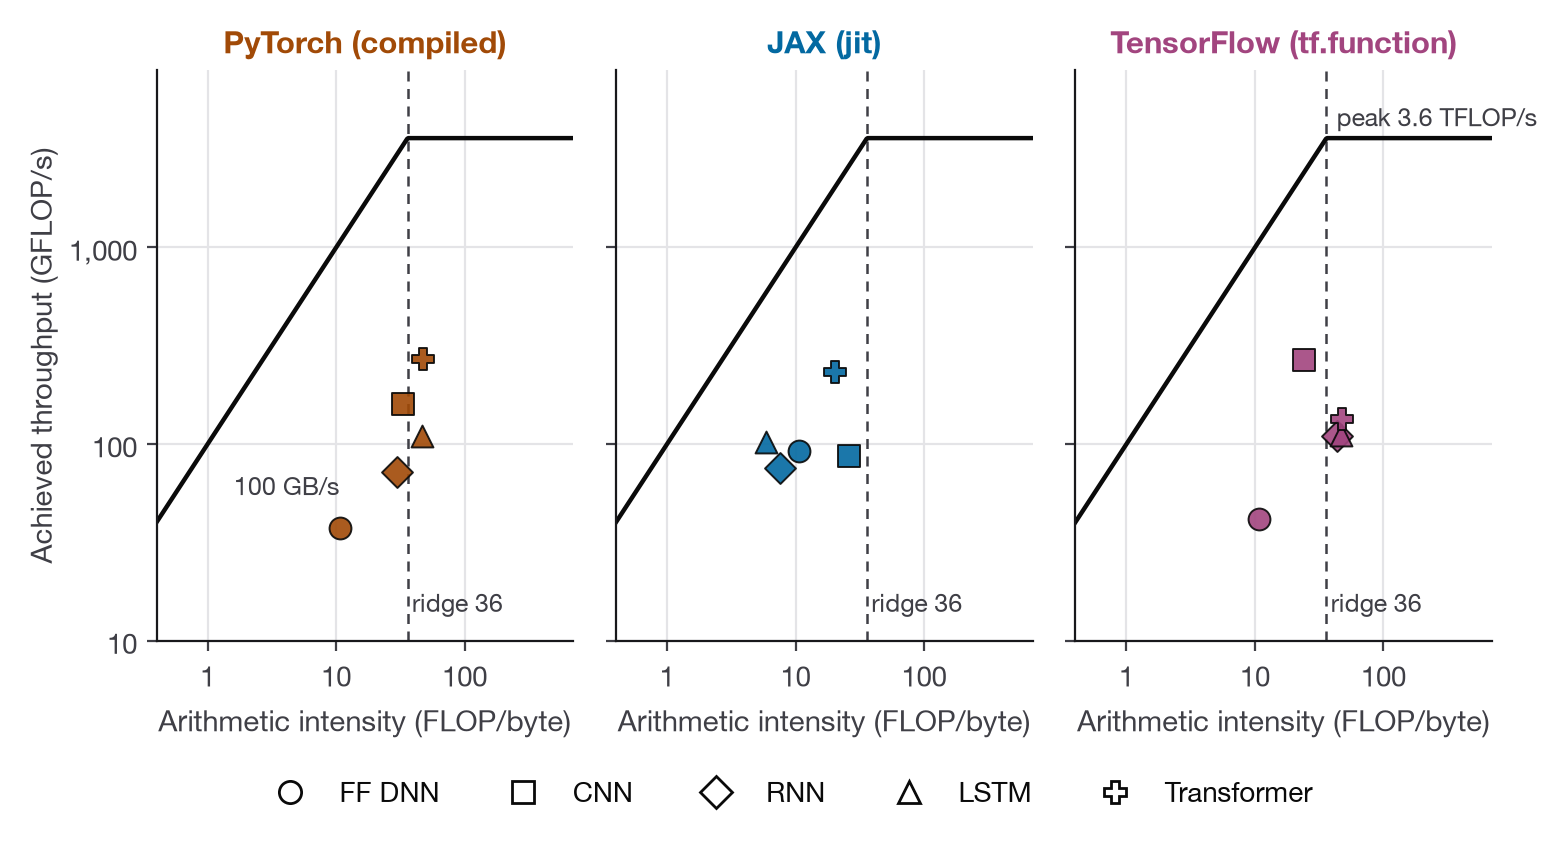
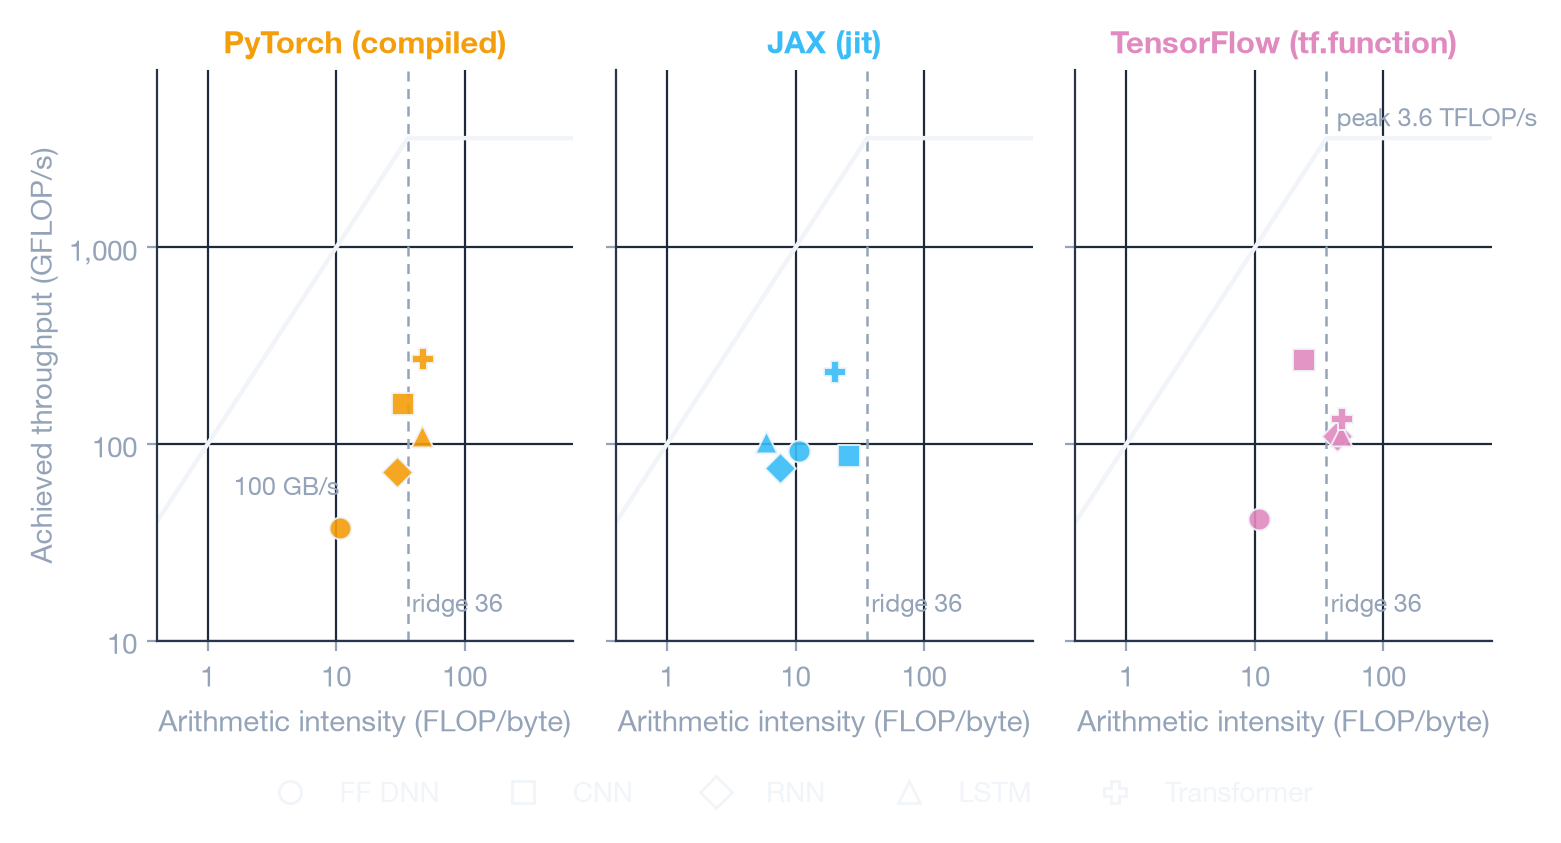
A few critical patterns emerge immediately from the roofline distribution:
- Inference at small-to-medium batch sizes is overwhelmingly memory-bound. Feedforward DNNs ( FLOP/B) and CNNs ( 24–33 FLOP/B) sit entirely to the left of the 36 FLOP/byte ridge point. Their latency is dictated by how efficiently memory blocks are moved through CPU caches rather than raw arithmetic ALU throughput.
- Only parameter-reusing models cross the ridge point. As measured through PyTorch and TensorFlow, the 2-layer LSTM ( FLOP/B) and Transformer encoder ( FLOP/B) technically have enough arithmetic operations relative to parameter and activation tensor volume to enter the compute-bound regime. JAX’s points all sit left of the ridge — its LSTM lands at just 5.9 FLOP/B — because
neural-cost’s JAX adapter counts traffic from jaxpr primitives rather than layer weights, so it sees more bytes moved for the same FLOPs. Compare JAX with the other two along the throughput axis, not the intensity axis. - Hardware saturation remains low on CPU. Even the fastest run at batch=32 — PyTorch eager on the Transformer — reaches only ~330 GFLOP/s, under 10% of the 3.6 TFLOP/s roof. At smaller batch sizes and modest hidden dimensions (), matrix shapes are not large enough to fully populate SIMD vector registers or sustain optimal cache-tiling strategies.
2. Latency Breakdown by Architecture
Comparing median latency across architectures at batch=32 highlights the massive divergence in runtime efficiency between frameworks.
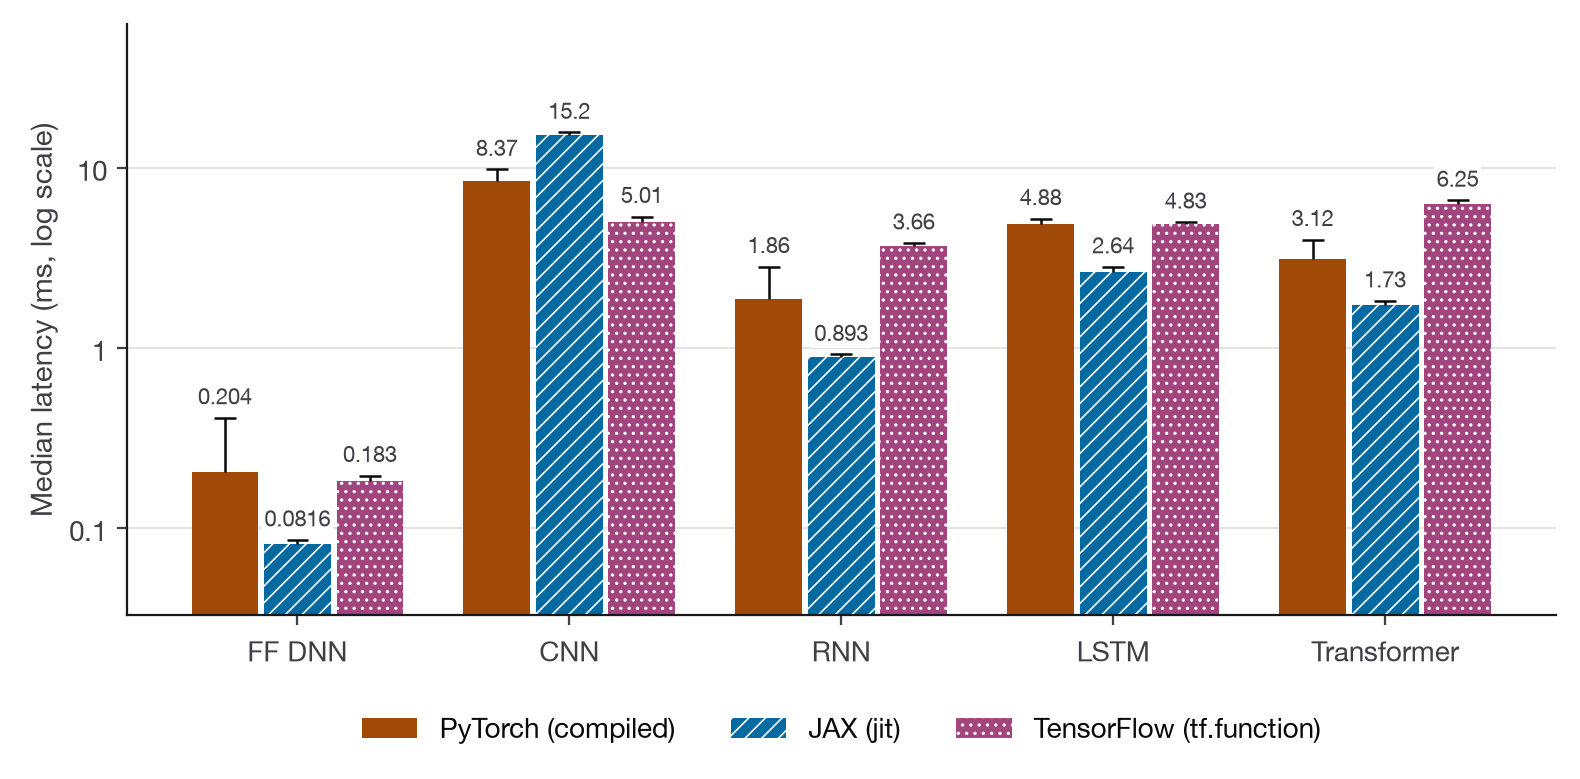
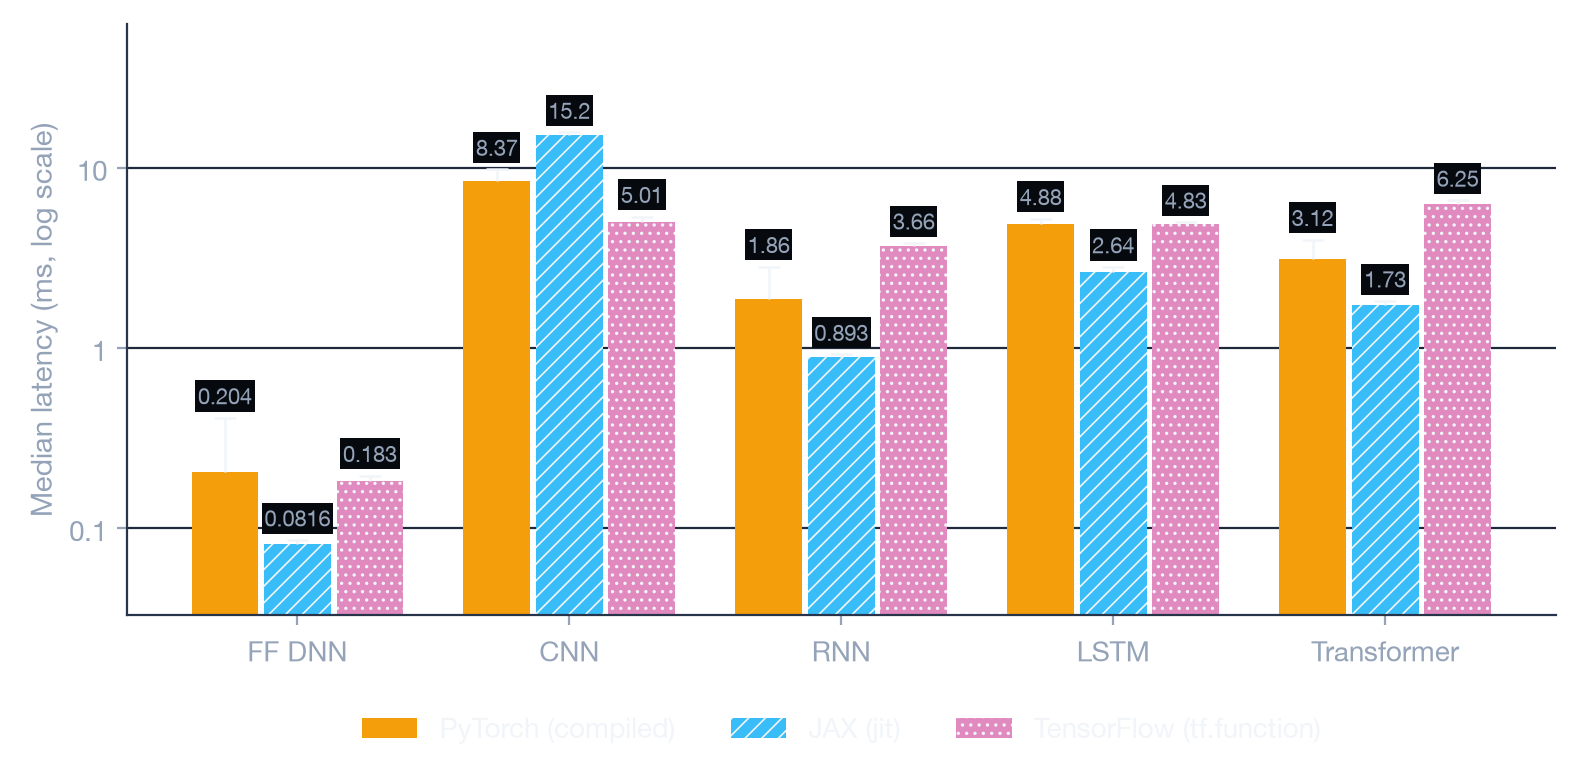
| Architecture | PyTorch (eager) | PyTorch (compile) | JAX (eager) | JAX (jit) | TF (eager) | TF (tf.function) |
|---|---|---|---|---|---|---|
| FF DNN | 0.062 ms | 0.204 ms | 0.096 ms | 0.082 ms | 2.602 ms | 0.183 ms |
| CNN | 9.067 ms | 8.372 ms | 6.352 ms | 15.213 ms | 8.647 ms | 5.012 ms |
| RNN | 1.778 ms | 1.862 ms | 1.490 ms | 0.893 ms | 64.474 ms | 3.661 ms |
| LSTM | 4.831 ms | 4.880 ms | 4.616 ms | 2.643 ms | 50.418 ms | 4.830 ms |
| Transformer | 2.586 ms | 3.122 ms | 1.827 ms | 1.731 ms | 20.224 ms | 6.251 ms |
Bold marks the fastest run in each row. On the FF DNN that’s PyTorch eager: at this size, torch.compile only adds overhead.
Notice the disparity in recurrent workloads. In eager mode, executing 32 recurrent timesteps in Python causes TensorFlow to spend over 64 milliseconds on a 2-layer RNN, whereas JAX executes the exact same forward pass in 1.49 milliseconds—a 43× gap before compilation is even introduced.
3. The Compilation Showdown
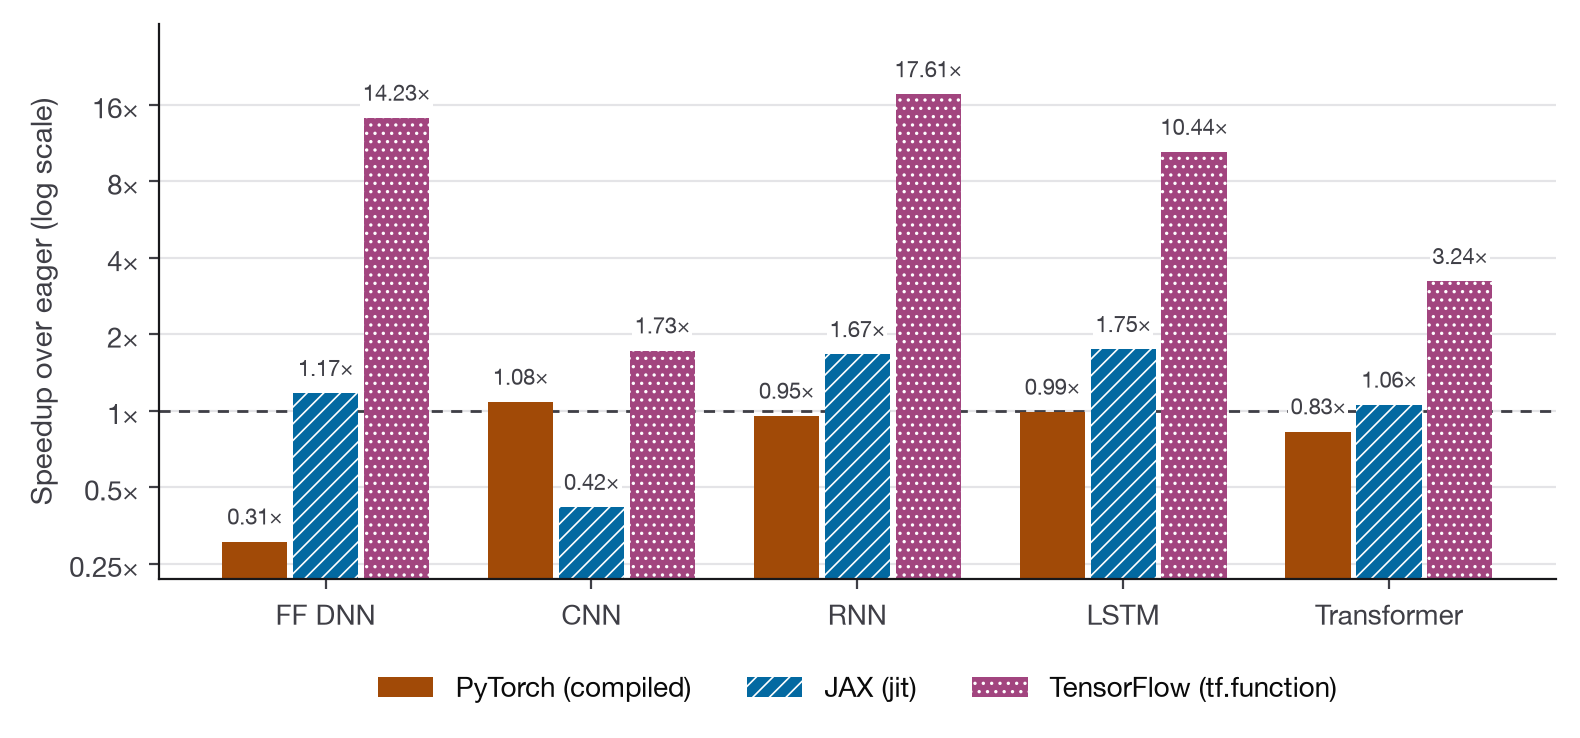
Each framework provides an optimization pipeline intended to trace operations, fuse kernels, and avoid runtime dispatch overhead. Figure 3 plots the speedup ratio (eager latency ÷ optimized latency) across all five architectures.
tf.function is transformative (10× to 17× speedup)
TensorFlow’s eager mode carries the heaviest per-op dispatch overhead among the three frameworks. Every single op invocation must cross the Python-C++ runtime boundary, query the device allocator, and queue an execution kernel. When a model executes many small operations sequentially (like an unrolled RNN or a dense projection stack), eager dispatch dominates wall-clock time.
Wrapping the forward pass in @tf.function compiles the entire model into a single static TensorFlow graph:
- RNN: Latency drops from 64.47 ms down to 3.66 ms (17.6× speedup).
- FF DNN: Latency drops from 2.60 ms down to 0.18 ms (14.2× speedup).
- LSTM: Latency drops from 50.42 ms down to 4.83 ms (10.4× speedup).
tf.function does not necessarily generate faster mathematical kernels; rather, it completely removes the suffocating Python dispatch bottleneck.
jax.jit provides surgical fusion and near-roofline efficiency
JAX approaches compilation differently: its eager mode already dispatches to optimized XLA primitives, so eager overhead is already modest. However, jax.jit still delivers substantial gains for sequential models:
- RNN & LSTM: Delivers 1.67× and 1.75× speedups at batch=32, bringing LSTM latency down to 2.64 ms (nearly 2× faster than either PyTorch or TensorFlow).
The standout result of the entire benchmark occurs at batch=1: jax.jit on LSTM reaches 99.5% roofline efficiency (0.18 ms observed vs. 0.18 ms theoretical bound). By compiling the timestep loop into a flat, statically scheduled XLA graph with zero dynamic memory allocation, JAX completely saturates the theoretical capability of the hardware.
torch.compile() on CPU: Diminishing returns & regressions
One of the most surprising findings was the behavior of torch.compile() on CPU:
- On CNN,
torch.compile()provided a modest 1.08× speedup (9.07 ms → 8.37 ms). - On recurrent and feedforward models at batch=32, it yielded flat or regressed performance: 0.95× on RNN, 0.99× on LSTM, 0.83× on Transformer, and 0.31× on FF DNN.
Why did PyTorch compile regress on CPU at small batch sizes?
PyTorch eager CPU is already backed by decades of hand-tuned, assembly-optimized C++ BLAS libraries (MKL-DNN / OpenBLAS). When torch.compile invokes its default Inductor backend on CPU, it generates custom C++ OpenMP kernels. At small batch sizes and small hidden dimensions (), the overhead of thread pool synchronization and less aggressive loop vectorization in generated C++ can be slower than vendor-tuned GEMM kernels.
Inductor was primarily designed for GPUs, where kernel fusion eliminates massive VRAM round-trips and tensor cores require specific tiling patterns. On CPU at small batch sizes, PyTorch eager is remarkably difficult to beat.
4. Roofline Efficiency Heatmap
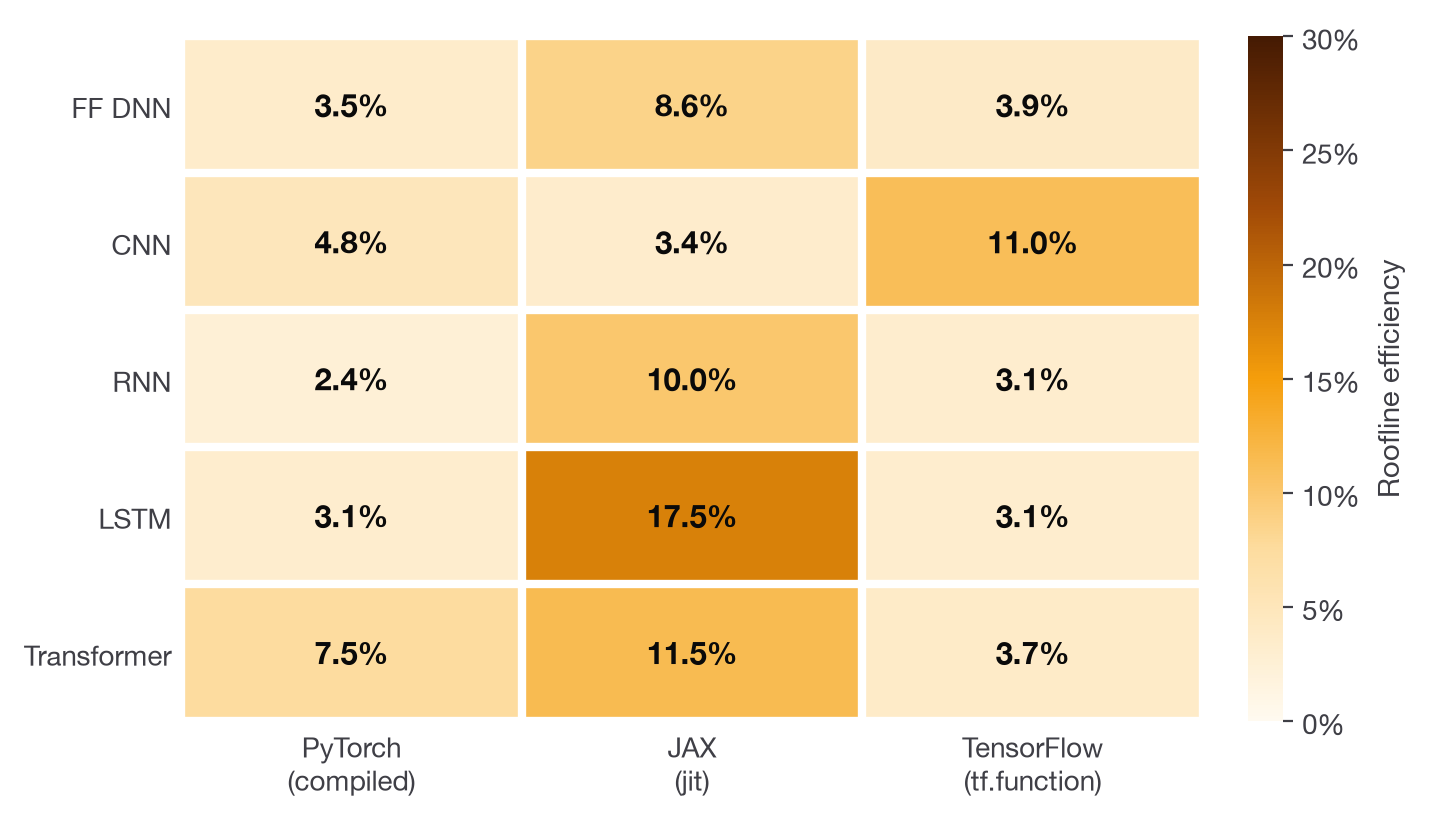
Roofline efficiency measures what percentage of the theoretical performance ceiling was achieved by the runtime:
Looking at the efficiency matrix:
- JAX JIT leads in efficiency on four of five architectures, achieving 17.5% on LSTM, 11.5% on Transformer, and 10.0% on RNN.
- TensorFlow eager is deeply inefficient for sequential models (0.2% on RNN and 0.3% on LSTM), but
tf.functionrestores it to 3.1%–11.0%. - CNN efficiency peaks under TensorFlow (11.0%), because TensorFlow’s underlying CPU Conv2D implementation is exceptionally well-tuned for unified memory layouts.
What is eating the headroom?
Even for the best-performing compiled variants, efficiency numbers rarely exceed 15–20% on CPU. The neural-cost gap analysis identifies four primary sources of overhead:
- Launch & dispatch latency: Fixed overhead per kernel invocation that cannot be amortized when total execution time is under a millisecond.
- Untiled inner dimensions: Matrix multiplications with fall below typical cache-blocking and register-tiling thresholds designed for matrices with dimensions in the thousands.
- Activation buffer allocations: Allocating intermediate workspaces between layers incurs page-table and memory management costs.
- Recurrent dependency chains: Each timestep requires serialized write-back of hidden state vectors before the next step can proceed.
5. Scaling with Batch Size
We swept batch sizes of 1, 8, 32 and 128 to observe how memory pressure and runtime dispatch behave under scaling.
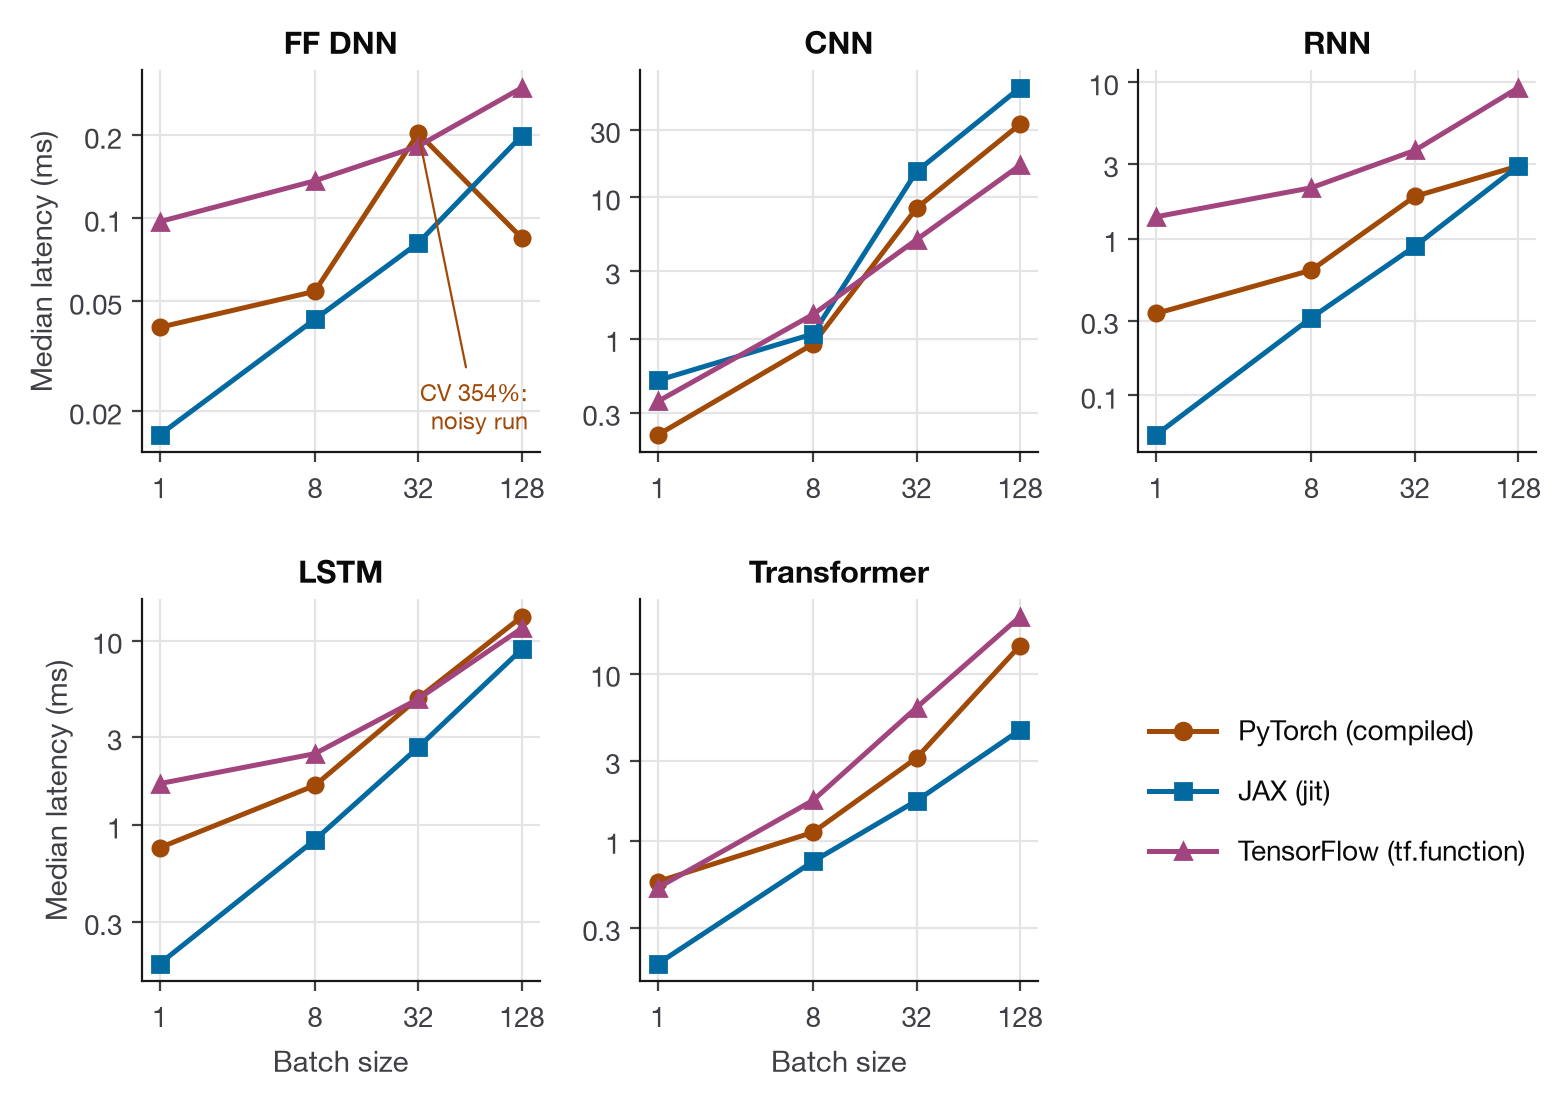
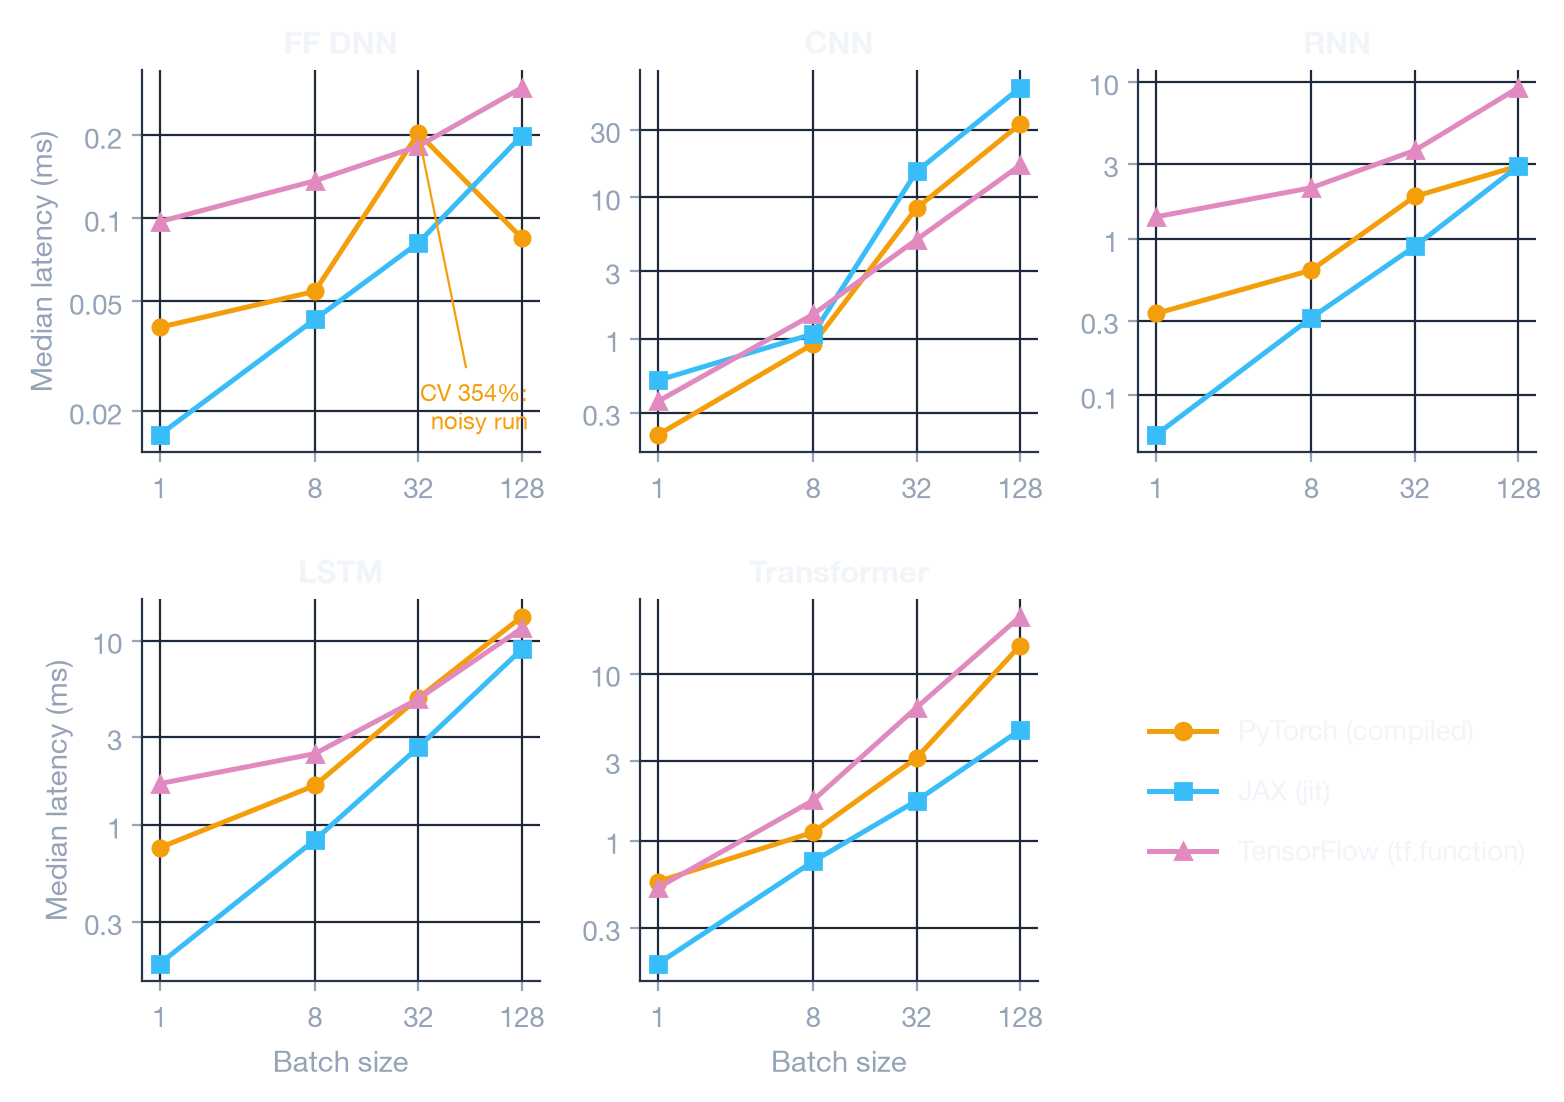
Three observations stand out:
- Roughly proportional growth at larger batches: Between batch 32 and 128 (4× the work), latency rises 1.6–4.7× (the noisy FF DNN point aside). Because these workloads operate predominantly in the memory-bound regime, more samples means proportionally more tensor traffic through the memory bus.
- The CNN falls off a cliff between 8 and 32: PyTorch and JAX CNN latency jumps 9–14× for 4× more data, which suggests the activations stop fitting in cache. TensorFlow’s CNN rises only 3.4× over the same step.
- One point is noise, not a trend: PyTorch’s compiled FF DNN gets faster from batch 32 to 128 (0.204 → 0.085 ms). The batch-32 run is the one with a 354% coefficient of variation (Figure 6), so don’t read anything into that dip.
The figure plots optimized variants only, but the full results show the eager penalty shrinking with batch size too. At batch=1, dispatch overhead masks raw execution time: JAX’s eager LSTM is 22× slower than its jit version. By batch=128 that gap is 1.6×. TensorFlow is the exception — eager still runs 1.5–9× slower than tf.function at batch=128.
6. Measurement Stability & Noise
Benchmarking ML runtimes requires measuring not just speed, but reproducibility. We tracked the Coefficient of Variation () across all 40 iterations.
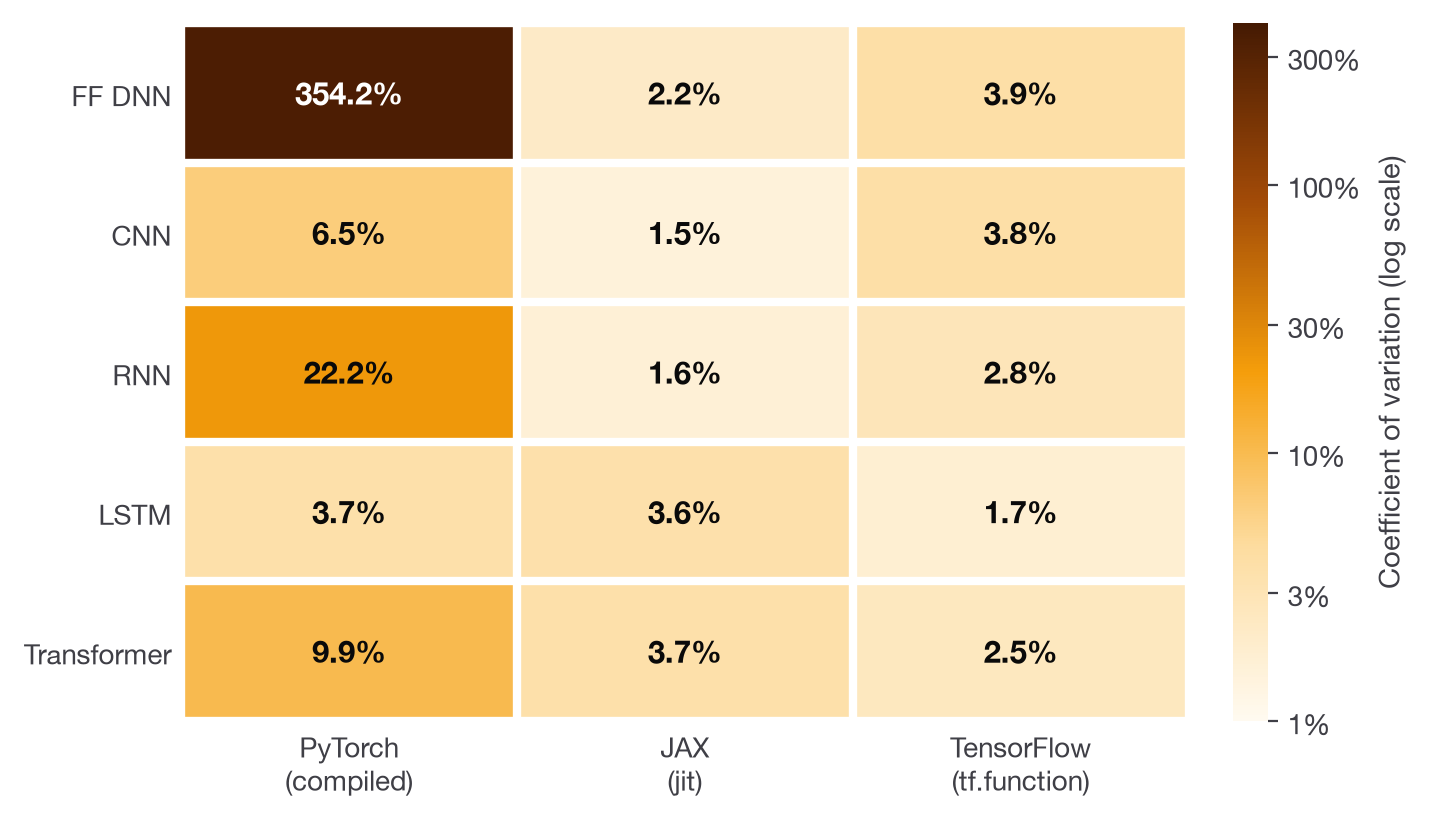
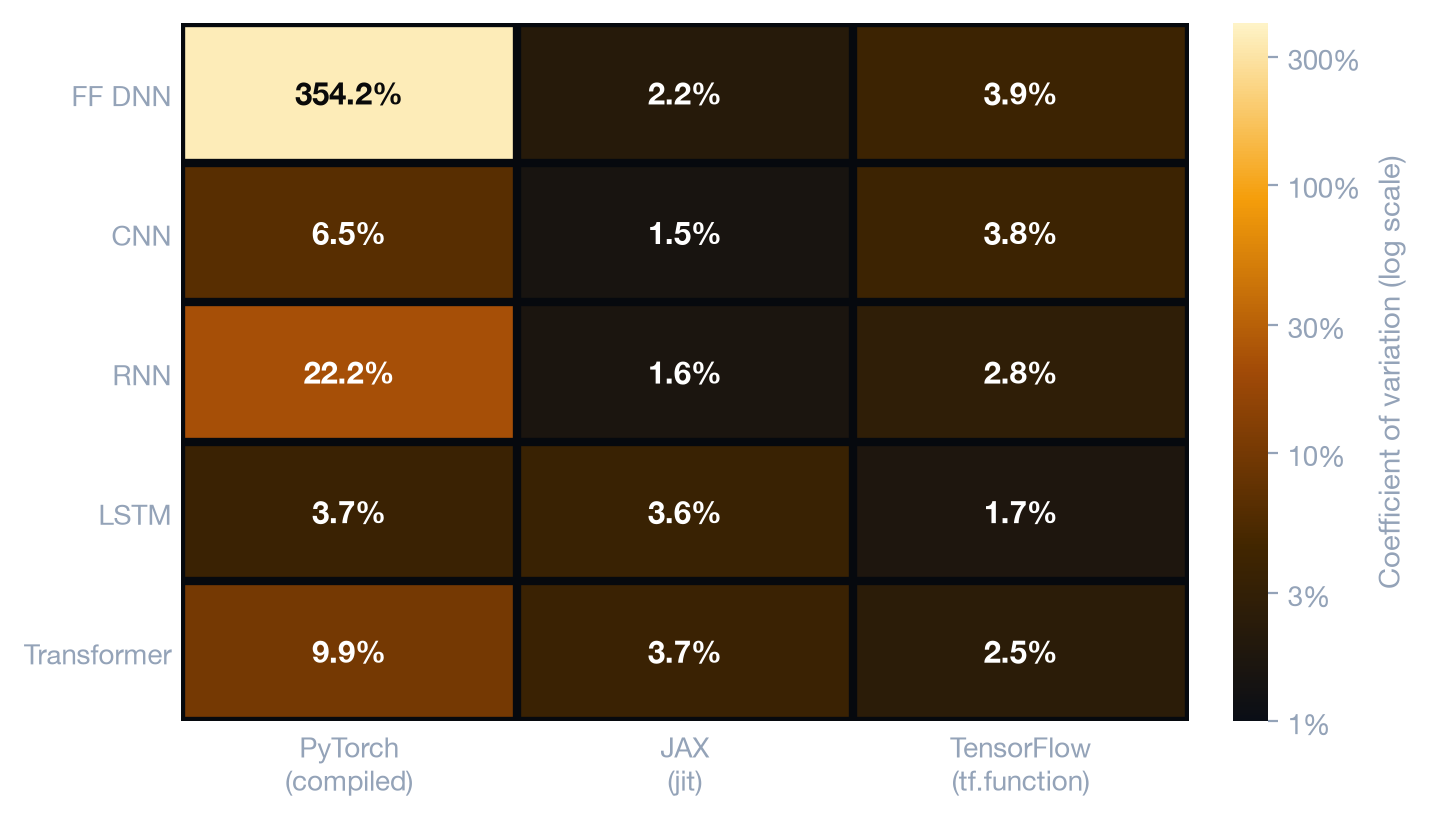
The stability findings are unambiguous:
- JAX JIT is consistently quiet ( 1.5–3.7%): Ahead-of-time compilation produces the same execution trace every iteration, without dynamic garbage collection pauses or thread pool thrashing.
tf.functionkeeps TensorFlow steady ( 1.7–3.9%). Eager TensorFlow wasn’t much noisier on average (1.1% on RNN, 8.0% on LSTM) — its problem is speed, not variance.- PyTorch compiled is the noisy one. Its hits 354% on the FF DNN, 22.2% on the RNN and 9.9% on the Transformer, most likely from thread scheduling variability in the Inductor CPU runtime. A that high means a few very slow iterations: the FF DNN’s median is 0.204 ms but its mean is 0.777 ms. The median is still usable; the mean isn’t.
Architecture-by-Architecture Winners
Summing up the optimized variants at batch=32 (detailed in the full results table):
| Architecture | Fastest Framework | Latency | Efficiency | Notes |
|---|---|---|---|---|
| FF DNN | JAX (jit) | 0.082 ms | 8.6% | 2.2× faster than TF, 2.5× faster than compiled PyTorch. Eager PyTorch (0.062 ms) beats all three |
| CNN | TensorFlow (tf.function) | 5.012 ms | 11.0% | TF’s CPU Conv2D kernel outperforms PyTorch (8.37 ms) and JAX (15.21 ms) |
| RNN | JAX (jit) | 0.893 ms | 10.0% | 2.1× faster than PyTorch (1.86 ms), 4.1× faster than TF (3.66 ms) |
| LSTM | JAX (jit) | 2.643 ms | 17.5% | 1.8× faster than PyTorch (4.88 ms) and TF (4.83 ms) |
| Transformer | JAX (jit) | 1.731 ms | 11.5% | 1.8× faster than PyTorch (3.12 ms), 3.6× faster than TF (6.25 ms) |
JAX won 4 out of the 5 architectures among optimized variants, primarily due to XLA’s ability to fuse sequential elementwise operations and eliminate Python dispatch overhead. TensorFlow took the crown in CNN, showing the maturity of its CPU convolution implementations. One caveat: counting eager runs too, PyTorch eager takes the FF DNN.
Practical Takeaways for ML Engineers
- Compilation pays off when framework overhead dominates, not necessarily when BLAS does.
tf.functiongave massive 14×–17× speedups not by improving matrix multiply kernels, but by bypassing Python loop dispatch. If your model has loops or fine-grained operations, compilation is mandatory. - Don’t assume
torch.compileis a free lunch on CPU. On GPUs with large batch sizes,torch.compileis indispensable. But on CPU for small-batch inference, PyTorch’s eager C++ kernels are often faster and more predictable than Inductor codegen. Always measure before deploying. - JAX remains the gold standard for predictable, small-to-medium inference. If you need minimal latency, rock-solid execution determinism ( under 4% on every architecture here), and near-roofline efficiency on recurrent structures,
jax.jitis exceptionally hard to beat. - Always know your arithmetic intensity. If your model’s is under 36 FLOP/byte, optimizing FLOPs will not make it faster. Your performance bottleneck is memory traffic, tensor allocation, and cache reuse.
Code and Reproducibility
All benchmarks, automated figure generators, and full tabular data are open-source and reproducible on GitHub:
- Benchmark Repository:
davidgraymi/ML-Framework-Comparison - Scientific Benchmark Report:
BENCHMARK_REPORT.md - Raw Telemetry Dataset:
benchmarks/results/benchmark_data.json - Report & Plot Generator:
benchmarks/generate_report.py - Roofline Analysis Library:
neural-coston GitHub (see also our neural-cost deep dive)
Updated October 19, 2026: corrected the fastest FF DNN result (eager PyTorch, not JAX), the RNN and Transformer speedup ratios in the winners table, and the measurement-noise figures, which now match the heatmap. The charts were regenerated from the same raw data.