neural-cost
A framework-neutral Python library that tells you how fast a neural network should run, not just how fast it does — FLOPs, tensor traffic and a roofline model across PyTorch, JAX and TensorFlow.
- Type
- Personal
- Year
- 2026
- Built with
- Python · PyTorch · JAX · TensorFlow · Roofline modeling
A timer tells you how fast a model runs. It doesn’t tell you whether that’s good. To know how much performance is left on the table you need a model of the hardware, and a way to count what the network actually asks of it.
neural-cost does that counting. It estimates a network’s FLOPs and the bytes it moves, measures its real runtime, and compares the two against the chip’s roofline: the faster of its compute limit and its memory-bandwidth limit. The ratio is roofline efficiency, a number from 0 to 100% that says how close the run got to the hardware’s ceiling and which limit it hit.
The constraint
Every framework already has a profiler, and none of them agree on what they measure. I wanted one analysis that could sit above PyTorch, JAX and TensorFlow and give comparable numbers for all three, so a framework comparison measures the frameworks rather than their tooling.
The answer is a small FrameworkAdapter protocol. An adapter turns a model into
a list of portable operation records (a matrix multiply of this shape, a
convolution of that one) and knows how to time it properly for its framework:
CUDA synchronization for PyTorch, waiting on async dispatch for JAX, allocator
statistics for TensorFlow. Cost estimation, memory analysis and gap analysis
only ever see the portable records. A new framework or accelerator is one
subclass.
It also profiles training memory: parameters, gradients and optimizer state, plus a lower and upper bound on activation memory that real allocator telemetry should land between.
Putting it to work
The library was the means; the questions were the point. I used it for two benchmark studies on an Apple M3, five architectures each (feedforward, CNN, RNN, LSTM and Transformer), eager against compiled modes, across batch sizes.
- On the CPU, JAX’s
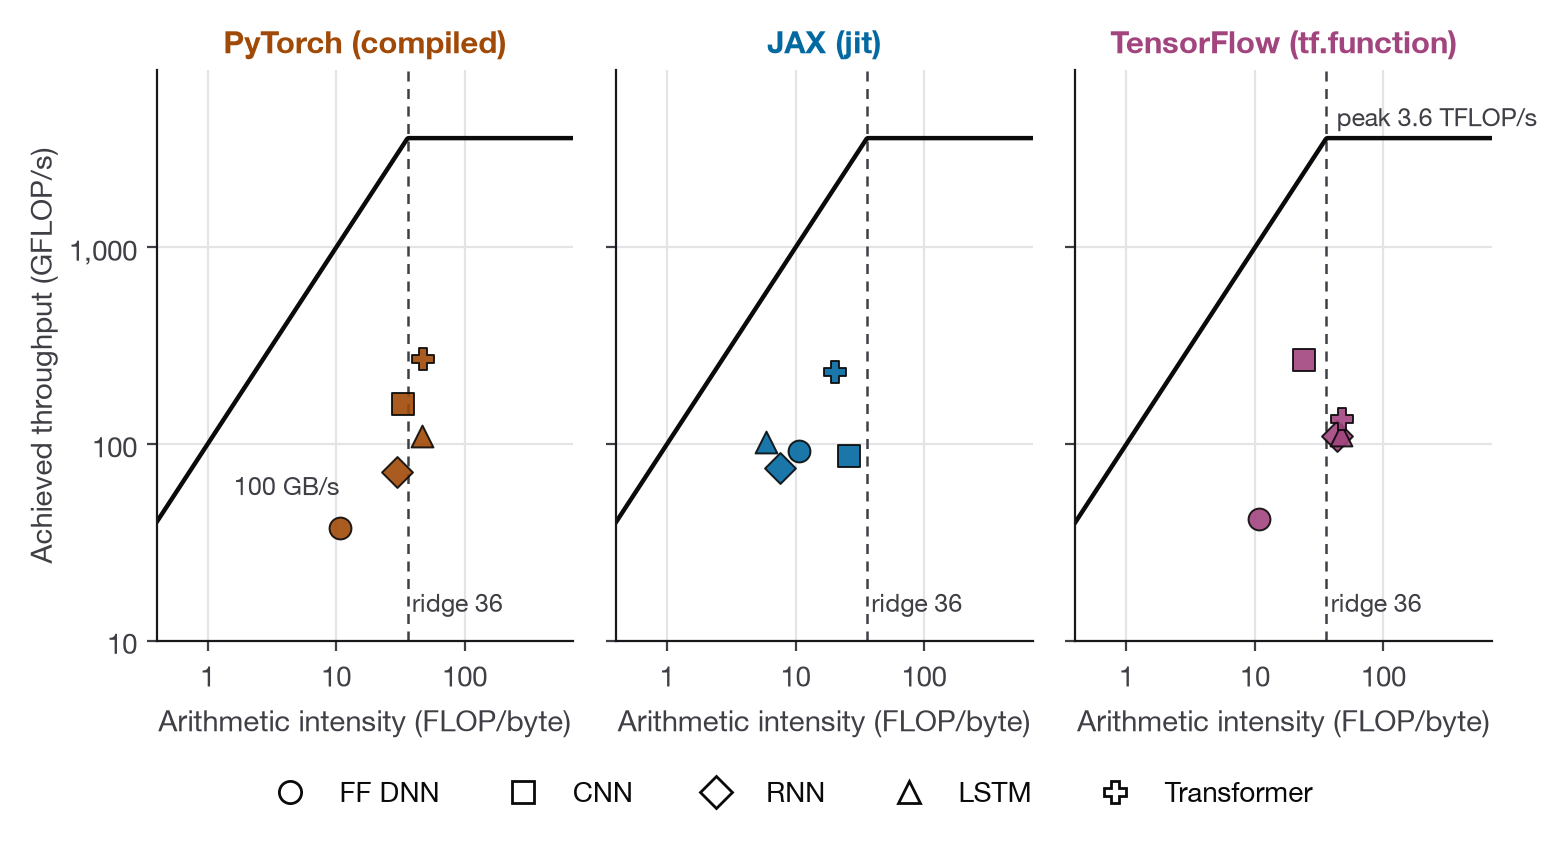
jitwon four of the five architectures, TensorFlow won the CNN, andtf.functionmade TensorFlow’s RNN 17.6× faster by removing Python dispatch rather than by improving the math.torch.compilerarely beat eager PyTorch, and made the feedforward model 3× slower. - On the GPU (Metal), the result flipped. PyTorch’s more mature kernels won four of five architectures at batch=256, and even the best runs reached only about a quarter of the roofline.
- Almost everything was memory-bound. Below 36 FLOPs per byte, the M3’s ridge point, cutting FLOPs doesn’t help. Fusion, precision and fewer materialized tensors do.
The write-ups below go through each result, with the raw data and the scripts that drew every chart.
What I’d do next
The roadmap is mostly about what per-device counts can’t see: activation
checkpointing, which trades compute for memory and makes the current upper
bound too pessimistic; the communication cost of distributed training; and
per-kernel traces for JAX and TensorFlow to match what PyTorch’s profiler
already gives. NVIDIA support, with CUDA event timing and nvidia-smi power
sampling, is the next backend.